Financial Model for Planning, Developing and Managing the Sabah Water Supply System

PRESENTED BY

Ir. PANG HOCK KIONG
(PERUNDING PKC SDN BHD)

e mail:

panghockkiong@hotmail.com

BACKGROUND

The Financial Model was first initiated during the Author’s tenure with the State Water Supply Department in 1998, at a time when the privatization and corporatization of the Water Department were key priorities. During this period, invitation letters were issued to various potential bidders to explore interest in undertaking the restructuring exercise.
It was widely recognized that a cash flow / financial model must be developed internally to assist the State Government, as well as the Water Supply Department, to evaluate the proposals
Hence, the author was at that time given the task/responsibility to develop the financial model. As a water supply operator, the author was able to access the real Data necessary to construct the Model.
However, the privatisation/corporatisation of the State Water Supply Department did not materialise after much negotiation.
The Financial Model developed at that time was poorly structured and, as a result, was not practical to implement.
Nevertheless, the development of the Financial Model did not cease. Following retirement, the Author continued to enhance and refine the Model, eventually transforming it into a full-fledged financial modelling system that offers greater flexibility and improved user-friendliness for its users.

INTRODUCTION

An Excel-based financial model has been developed to support better financial planning for the Water Supply Authority. It includes a 5-year cash flow projection, with the option to extend the analysis up to 40 years. Key investment metrics, such as IRR and NPV, are built in to support scenario testing and assess financial viability for potential corporatization.
The model is a key foundation for establishing the Water Commission (Regulatory Body) and transforming the Government’s water supply utility into a corporation. It presents financial visibility, long-term cost forecasts, and a practical evaluation of revenue adequacy, ensuring the sustainability of the corporatized entity while meeting regulatory and service requirements.
The evaluation excludes the cost of capital works, such as new water treatment plants and their associated infrastructure, because the State Government typically funds these. The program aims to assess production capacity and recommend the capital works needed to meet future demand and support longterm planning.
The water tariff, as the primary revenue source, is expected to cover O&M costs and, where possible, asset renewal and replacement. However, during the early stages of implementation, government subsidies will still be needed to maintain the desired service level.
Data collection for the program inputs will be conducted once a year to ensure the Model is updated with the latest operational and financial information.

With the application of this Model, the Management would be more vigilant of the
situation ahead, and remedial action can be taken earlier to alleviate major future
problems in the Water Supply system.

OBJECTIVE

Proper Implementation of the Model shall assist in satisfying the following criteria/objectives:

Adequacy

Sufficient to meet the current costs of Operation & Maintenance in a first stage and part of the capital expenditure (asset replacement) in a second stage of development of the model if desired

Affordability

Introduction of a social tariff for the low-income group and the setting up of adequate rates to promote commercial & industrial 
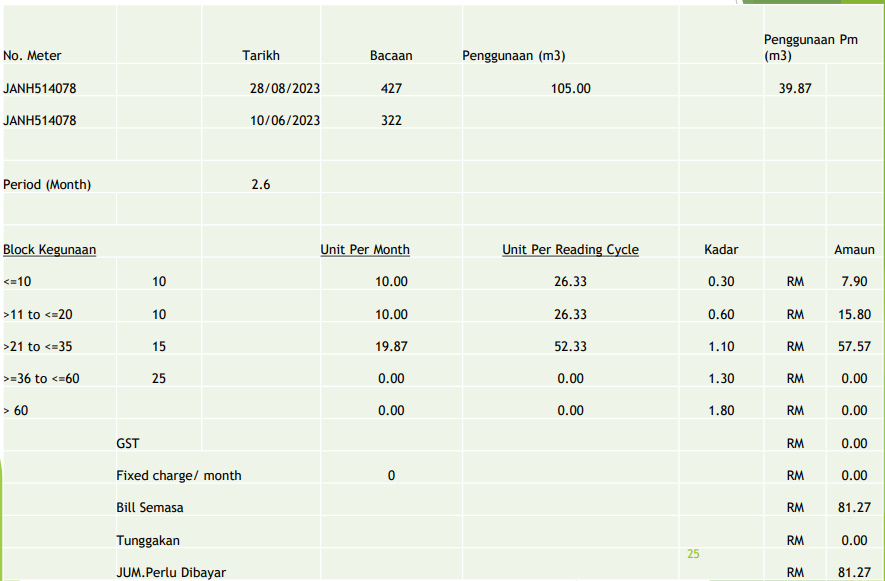
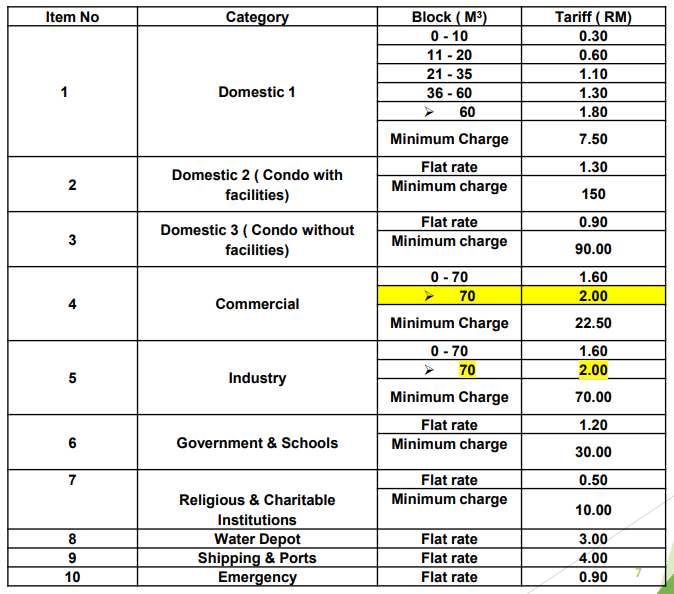
growth. At the Current domestic tariff and an average household consumption of 30 cu. m per month, the water bill would be about RM52.00/month, which is 1.6% of the minimum household income of RM3,137 at the poverty level. The recommended affordability level is 3% to 5% of household income.

Enforceability

the new tariff shall be fair & reasonable for a noncontroversial and easy implementation

Water conservation

With the yearly updated consumption pattern of each category, the new tariff shall create strong incentives for water conservation in the state

Historical continuity

To be in line with and related to the trend of model parameter variations and Data in recent years.

THE MODEL’S FEATURES

It can be used to monitor the physical and financial performance of the privatized / corporatized entity

Current Applicable Water Tariff (2015)

Assortment of women's sandals and flats | pangmonica

GRAPHICAL PRESENTATION OF THE MODEL

The “Key Control” shows data received/sent from all Divisions for processing; it can only be accessed by the Committee of Water Supply Authority for important decision-making.
Flowchart that showing data flow from 9 Divisions to Key Control.

GRAPHICAL PRESENTATION OF THE MODEL (Cont)

Busy fashion collage with text. | pangmonica
Tariff increase – The Rate of tariff increase for each sub-category can be simulated yearly, as shown in the blue line in the following graph. The intersection every 5 years would be the tariff to be implemented for the next 5 years ( red curve),
Sunglasses and wallet on display. | pangmonica

TIME SCHEDULE OF IMPLEMENTATION

The implementation could be in three stages for each Water Supply Authority:

Phase A

Training and presentation of the Model to Division Operators and Accounting Central Departments/computer billing section in HQ/Division.

Phase B

Calibration of the Financial Model over the last years and validation/estimation of the input data on “K factors” for the Division. And the decision on the “cut-off” ( financial year) to run the Model.

3 Phase C

Utilization of the Financial Model with the updated Drinking Water Tariff and the gathered data. Reports will be generated in graphical format to illustrate the financial and physical status of the water supply system.

NRW STATUS

Supply vs demand

Collection Efficiency

CONSUMPTION PATTERN

1. Dom 2. Spare 3. Commercial 4. Industry 5. Government & Educational Institution 6. Religion & Charity 7.Condo with facilities 8. Condo without facility 9. Water Depot 10. Shipping & Ports 11. Emergency
Pie chart showing 1st year consumption pattern.

CONSUMPTION PATTERN

1. Dom 2. Spare 3. Commercial 4. Industry 5. Government & Educational Institution 6. Religion & Charity 7.Condo with facilities 8. Condo without facility 9. Water Depot 10. Shipping & Ports 11. Emergency
Bar chart that showing 1st year water consumption pattern.

Total Sales and Collections

Total Sales and Collection projection graph 40yr.

The breakeven even

Exponential growth projection over 40 years.

Domestic Tariff Adjustment and Projection

D1 Domestic Tariff trend over 40 periods.

D1 category

D2 Tariff Condo with facilities increase trend.

D2 category

Commercial Tariff Adjustment and Projectiond Projection

C1 Commercial Tariff progressive adjustment graph.

C 1 Category

C 2 category

C2 Commercial Tariff increasing trend graph.

Industry Tariff Adjustment and Projection

I 1 Category

Line graph of I1 Industry Tariff increase trend.

I 2 Category

I2 Tariff Religion Charitable progressive trend.

Bulk Supply Tariff Adjustment & Projection

B 1 Category Government

B1 Government Tariff increasing trend graph.

B2 Category Religion & Charitable

B2 Tariff Religion Charitable progressive trend.

Bulk Supply Tariff Adjustment & Projection ustment & Projection

B3 Category

B3 Tariff Condo with Facilities (Dom 2) graph- PKO

B4 Category

B4 Condo Tariff projection without facilities- PKC

Bulk Supply Tariff Adjustment & Projection

B5 Category

B5 Water Depot Tariff progressive increase.

B6 Category

B6 Chart for Shipping Ports Tariff progressive increase.

The Billing

Collection of various shoes and sneakers. | pangmonica
Scroll to Top

Author profile

Ir. Pang Hock Kiong is an accomplished electrical engineer with a diverse career. He started in 1980 with the JKR airport project and later transitioned to Jabatan Air Sabah in 1988, where he served as an Operation and Maintenance engineer. After retiring from government service in 2005, he took on a leadership role, guiding a team of professionals, including legal advisors and accountants, to assist the State Government in renegotiating with water supply concessioners on bulk supply rates and fixed monthly fees. Currently, he runs PERUNDING PKC SDN BHD, providing expert mechanical and electrical consultancy services. His extensive experience and dedication to his field have made him a valuable asset in the engineering community.